The Stable Fund Series: article 2 of 5: When does it pay to be conservative?

Related links
No related links
In the first article of this series, we showed and explained the reasons for the long-term outperformance of the Nedgroup Investments Stable Fund.
However, we also understand that while long-term performance is the ultimate goal, periods of shorter-term underperformance are uncomfortable for investors.
Before we continue it’s important to recap on the Nedgroup Investments Stable Fund’s investment philosophy to produce inflation beating returns while avoiding capital losses. This is the driving force behind stock selection and asset allocation and at times this means that the fund will be more conservatively positioned and may also lag peers during some periods.
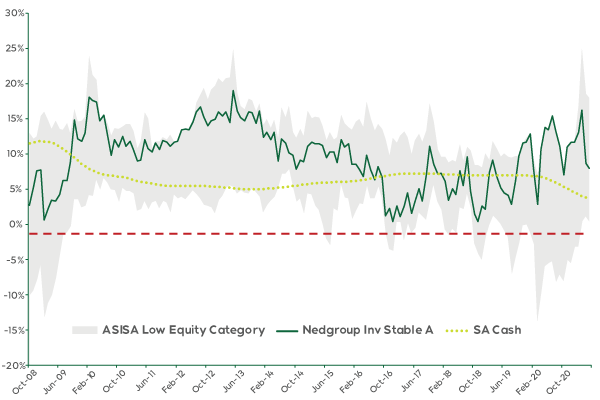
Let’s look at the shorter-term performance of the Fund, going back all the way to the Fund’s launch by plotting the rolling 1 year performances over this entire period. For the rest of this article, we will only include peers that have long enough track records as the Nedgroup Investments Stable Fund, and that remain in existence today:

Source: Nedgroup Investments, Morningstar, data to 31st May 2021
Some observations:
- The grey shaded area in the chart represents the returns of the peer group
- The Fund (green line) has experienced some periods of underperforming cash (dotted blue line) over its history since inception
- Underperforming cash is clearly not an occurrence that happens very often. Having said that, we know that when it does occur, it can cause concern for investors who don’t understand the investment philosophy employed within the Fund
Interestingly, periods of underperformance can turn around quite quickly and are typically followed by periods of strong returns. As a result, investors who sold their units have missed out on the subsequent gains. An example of this phenomenon occurred during the period 2016 to 2018 when the Fund suffered large outflows as investors became nervous due to a period of poor returns. However, those that remained have since been handsomely rewarded proving the old adage true once more: time in the market is more important than attempting to time the market.
It’s also important to note that the Stable Fund has met its risk objective of avoiding capital losses over rolling 12 month periods (shown by the green line above red dashed line), unlike some of its peers in the category. This means that the fund managers will tend to be more conservatively positioned during periods when they assess the risk of potential capital losses to be too high.
Now back to the issue of underperforming cash: essentially the problem relates to the fact that the fund has to invest in more risky securities in order to outperform its benchmark of inflation + 4% over time. This leads to higher volatility in Fund returns, far more so than one would experience by investing in a Money Market Fund.
So is it worth it? Our analysis of market returns going back over more than 100 years shows that investing in cash has typically outperformed inflation by about 1% p.a. on average. So how can we add another 3% p.a. on top of that?
The largest determinant of returns tends to be due to your asset allocation. And in the absence of perfect foresight to shift your asset allocation at just the right time to avoid any capital losses, the reality is that holding equity, property and bonds (local and offshore) will result in portfolio volatility.
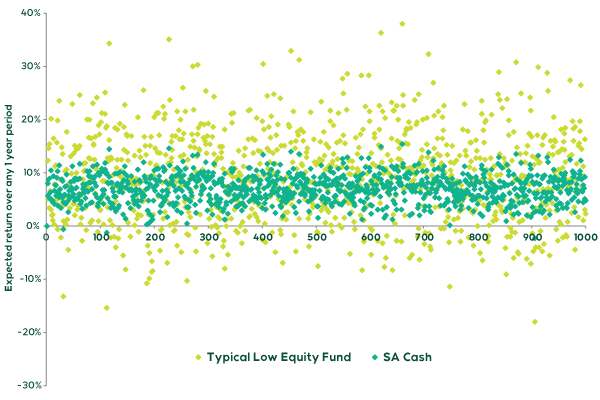
In the chart below, we’ve modelled one year forward-looking expected returns using the asset allocation of a typical low equity fund (green dots) and compared it to the typical expected returns from cash (blue dots). We’ve catered for scenarios like high inflation and/or high interest rates as well as for shock events like a large issuer’s credit default as we experienced with African Bank in 2014. We’ve also considered scenarios like a rapid strengthening or weakening of the rand, sharp upward or downward moves in equity/property/bond markets, and so on. The end result is that one gets a pretty good picture of what can be expected over any given year. There are 1000 simulations of each displayed below:

Source: Nedgroup Investments
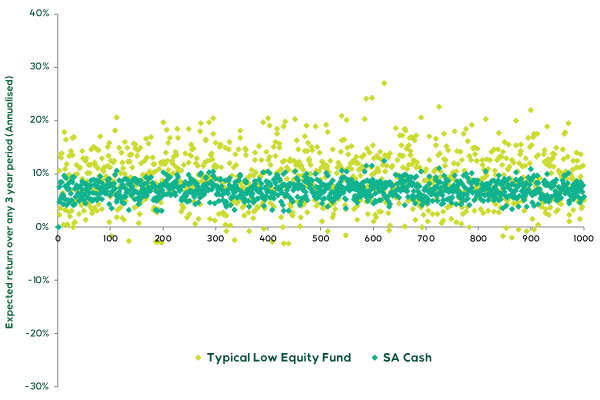
But what does this picture look like over a longer time frame, such as over three years?

Source: Nedgroup Investments
Here one can see that on an annualised basis over three years, the typical low equity fund’s returns are far more predictable (ie. falls within a narrower range) compared to one year periods and it has a much better return profile relative to cash for investors with longer term horizons and who need higher returns while minimising capital losses at the same time.
In summary, our illustrations show that cash is less volatile. However, it will also give you a lower return on average. So, while we are aware that the relatively rare short-term periods of underperforming cash may be uncomfortable for investors, it is our commitment to outperformance over the long-term while avoiding permanent impairment of capital that drives our investment decisions.
In the next article we will examine in more detail how market conditions over the past few years have affected the global investment industry, the South African investment industry and the Nedgroup Investments Stable fund in particular. This will provide further insight into why holding a longer-term perspective is a valuable investment habit to cultivate.

For a better experience of the Nedgroup Investments website, please try the latest version of these browsers


